The Ham Shack, circa 2015-2017
Ham Shack Photographs and Descriptions
Photographs, Station | |
Photographs, Antennae | |
Antenna Site Measured Noise Levels | |
Wiring Diagrams, RF Cables | |
Remote Hams Interface |
![]()
Photographs, Station
This is my station in 2015-2017. I have successfully migrated the main rig from my IC-756 PRO-III to my Elecraft line SDR.

Elecraft KX3 QRP SDR Radio, 160-6 Meters
Elecraft KXPA100, 100W Amplifier
Elecraft KPA500, 500W Ampflifier
Elecraft KAT500, 500W Antenna Tuner
SDR Software User Interface, Win4K3 Suite, Internet URL: http://www.va2fsq.com
2nd View of Station

I still maintain an ICOM radio setup for HF digital work and for 2 Meter VHF and 2M/440MHz FM.
The radios include the ...

ICOM 756 PRO-III (160-6M), 746PRO (160-2M), and the
Yaesu FT-8800R (V/UHF) and FT-817 QRP (160-2M, 440MHz).
My current antennas includes:
| Antenna Type | Bands Covered (with Antenna Tuners) |
|
160m full size dipole |
80m, 60m, 20m |
|
End Fed 80m Half Wave Dipole |
80m, 40m, 30m, 20m, 17m, 15m, 12m, 10m |
| 40/30m full size vertical | 40m, 30m |
| 20-10m vertical, The Texas Star | 20m, 17m, 15m, 12m, 10m |
| 20m full size vertical | 20m, 17m |
| 6m MOXON beam | 6m |
| 2m, 4 element horizontal beam | 2m |
| 2m/440MHz vertical | 2m, 3/4m |
Vendor URL links:
DX Engineering DXE 4030VA-1, https://www.dxengineering.com/
MyAntenna EFHW-8010-1k, http://myantennas.com/wp/product/efhw-8010/;
LNR, R600 Tuner, http://www.lnrprecision.com/endfedz/;
Arrow Antennas, Model GP 146/440 Ground Plane, http://www.arrowantenna.com ;
Par Electronics, Model SM-50 MOXON, 6m beam, http://www.parelectronics.com/stress-moxon.php .
I also have the DX Engineering 8-port, RF switch remotely installed to select antennas using one feedline.
Photographs, Antennae
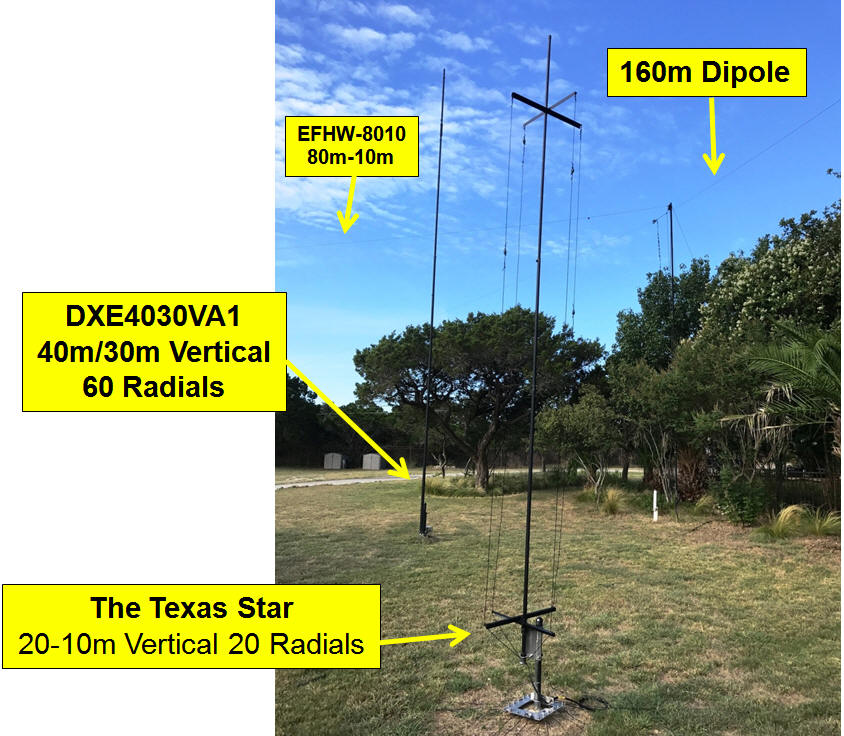
Here are some photographs of the installation.

Antenna Field (Left to Right)
|
DXE4030VA1, 60 Radials, Vertical (40m/30m) | |
|
The Texas Star 20-10m, 5-bands. 20 Radials | |
|
MyAntennas EFHW8010, End Fed Dipole (80m-10m, all bands) | |
|
Dipole, 160m (160m) |


Antenna Site Measured Noise Levels
Noise measurements were taken using the station transceiver, a KX3 SDR, with spectral display calibrated against an RF power standard, -73 dBm equivalent to an S9 level. Two techniques were used to arrive at the S-meter reading. The first was reading the S-units directly from the station receiver's S meter. Due to the nature of noise, the readings had to be eye-ball averaged to get a single value. The second method uses a 16 spectral average to "calm" the noise to an easier level to make a measurement from the spectral display. To compensate for the noise reduction inherent in making an average measurement, the equation 10 Log ( # Averages ) was added to the spectral measured level. One S-unit was assumed to be equal to a change of 6 dB. In the graph below, the large red dots were the averaged levels calculated using this method and the blue rectangles were from the receiver's S-meter.
The noise measurements were plotted on the ITU-R P.372-13, 09/2016, "Radio Noise" (ref. Figure 10 from https://www.itu.int/rec/R-REC-P.372-13-201609-I/en) chart that represents the noise expected in a 500 Hertz bandwidth in Residential, Rural and Quite Rural areas. Also, the Typical Receiver Minimum Discernible Signal (MDS) was also plotted on the chart. My measurements indicate noise levels commensurate with a Rural setting. This was to be expected.
Good agreement was seen between these two methods. Close scrutiny of thee graphs make it appear the noise levels at 160m and 80m (1.8 MHz and 3.5 MHz, respectively) was lower than the typical rural setting. I reasoned this was due the use of a horizontal antenna (instead of the vertical antenna used in the ITU studies) and both of my dipole antennas placed too close to the ground. This reduces the efficiency and directivity of both antennas that manifests itself in reduced noise, in addition to, reduced signal strengths. The antennae for the other frequency bands were either vertical or end fed half wave (EFHW) antenna raised higher in terms of a fractional wavelength.
Noise measurements taken 6/8/2017, approximately 1200Z time.

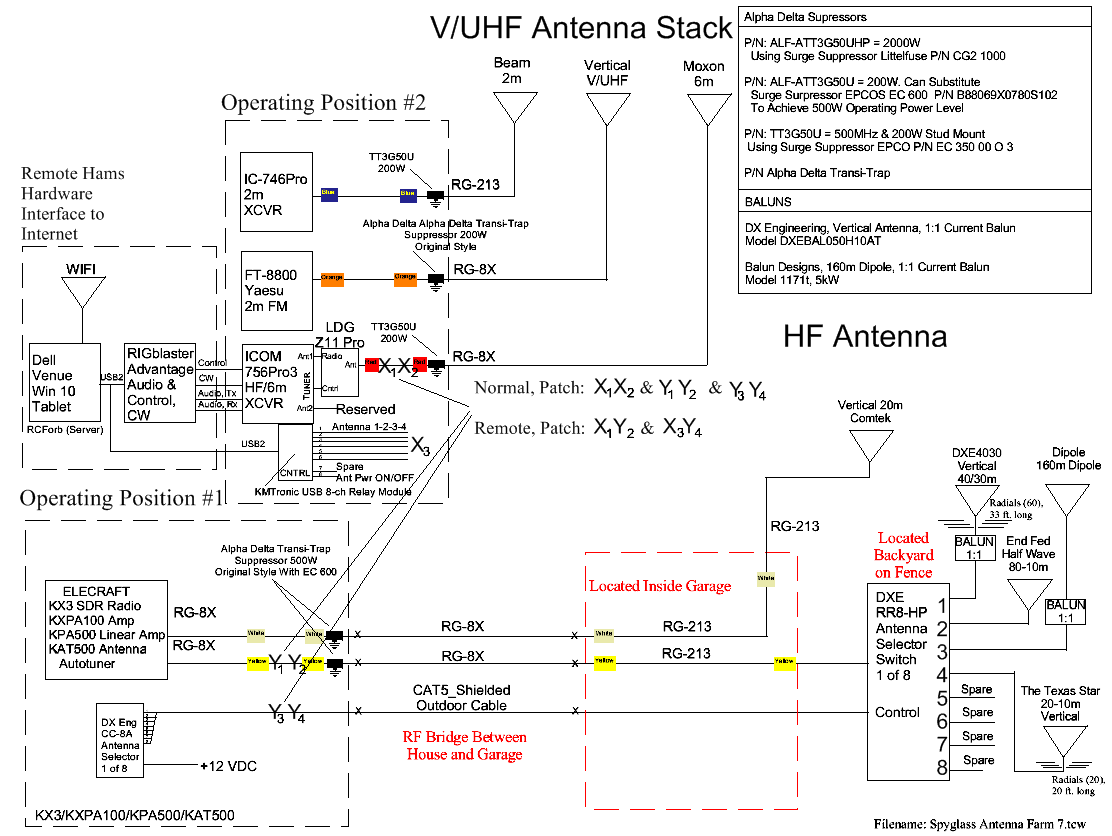
Wiring Diagram, RF Cables

.
Remote Hams Interfaces
Interconnect Diagram for Remote Hams Interface
